Predict & Prevent Customer Churn
Why are these customers canceling their subscriptions? Using consumer data to evaluate the cause of canceled subscriptions, we created a logistic regression classifier to predict the probabilities of our new customers unsubscribing. The data used to conduct this analysis was synthetically generated.
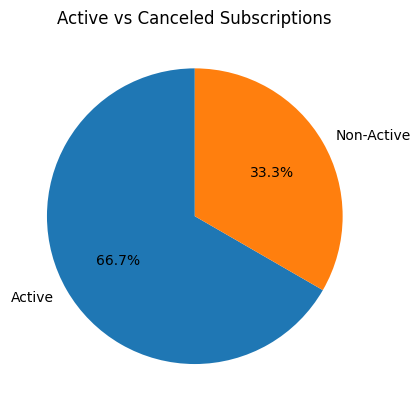
The data shows customer purchases, days since last purchase, # of support tickets, average order value, and subscription status. Upon investigating these numbers, we found the average total purchases to be much less for unsubscribers, while the time since last purchase and # of support tickets were higher for unsubscribers. The average order value was similar, even slightly higher in unsubscribers.
We fit a logistic regression model with these parameters and plotted the coefficients to see our best predictors in the churn prediction:
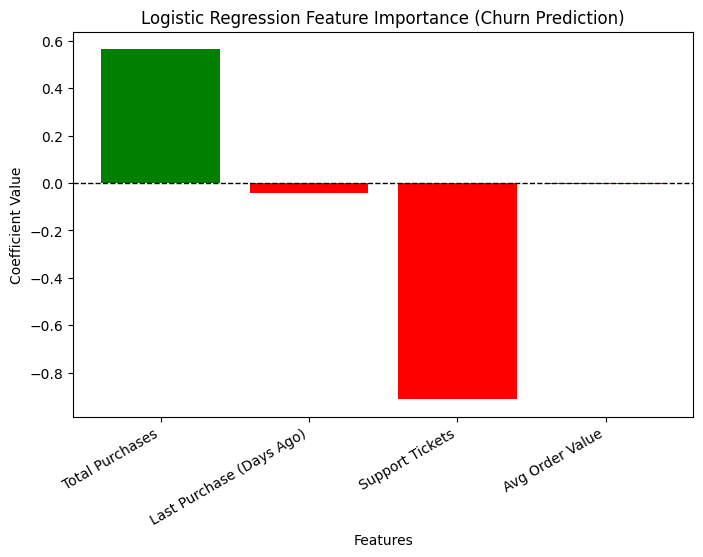
The total amount of purchases and total number of support tickets had the biggest impact on our customer's subscription status. High number of support tickets correlates with customer churn, while a high number of total purchases correlates with customers remaining active. The model performed close to perfect with an AUC score of 0.99. It got 98% of total predictions correct, while only misclassifying 3% of actual churners.
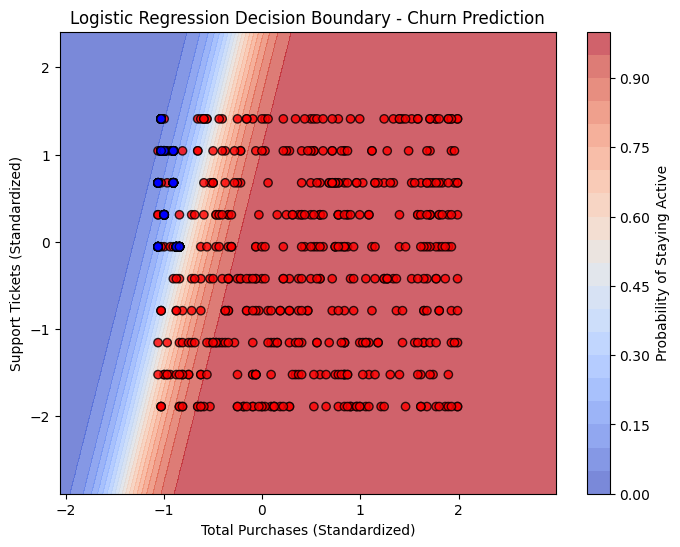
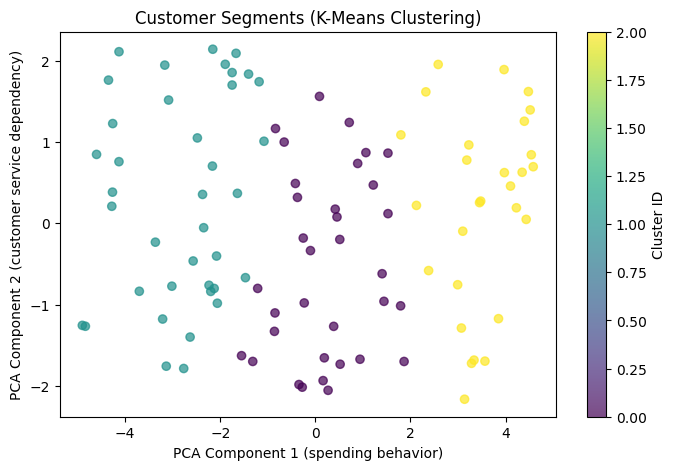
After creating this model, we introduced a dataset of 100 new customers and saught to predict their probabilities of churning. But first, we did a customer analysis using k-means clustering to get a better look at our new customer data. We chose 3 clusters using the elbow method for optimal clusters.

In the cluster chart below, customers on the right side (higher x-values) have high average order value, while customers at the top (higher y values) have a higher amount of support tickets. So customers in the top left are low spenders that contact support a lot, and customers in the bottom right are high spenders than rarely need support -- the ideal customer.
After running our logistical regression model with the new customer data, we found the majority of customers at a relatively low churn risk. The below scatter plot shows our customer's churn probabilities separating them at a threshold of 50%:
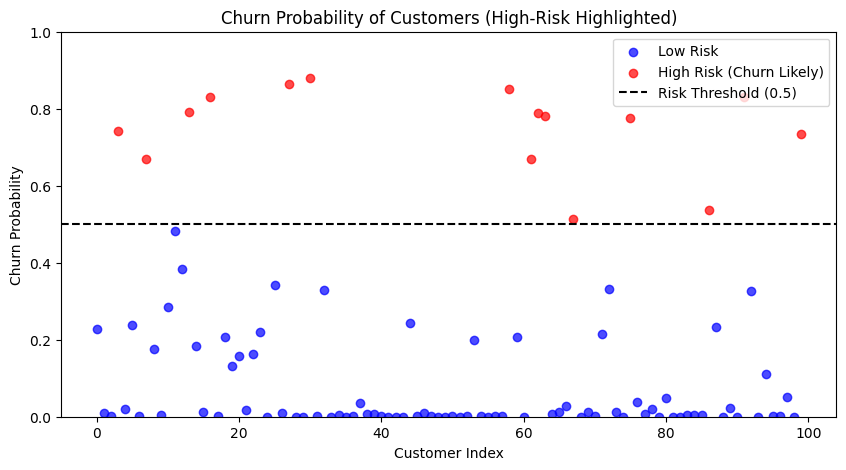
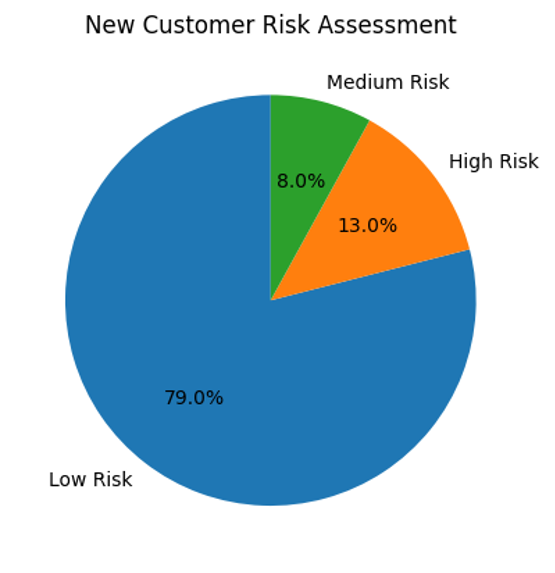
Upon further investigation of our 100 new customers, customers were classified into 3 categories: low risk (0%-30% probability), medium risk (30%-60% probability), and high risk (60%-100% probability) and found 79 low risk, 8 medium risk, and 13 high risk customers.
Given this limited data, to prevent churn the company needs to focus on fine-tuning our services resulting in a lower amount of support tickets, and perhaps offering better deals to increase engagement leading to a higher number of orders. To see more detail on this analysis, check out the jupyter notebook below.