Try them yourself
Interactive Demo Dashboards
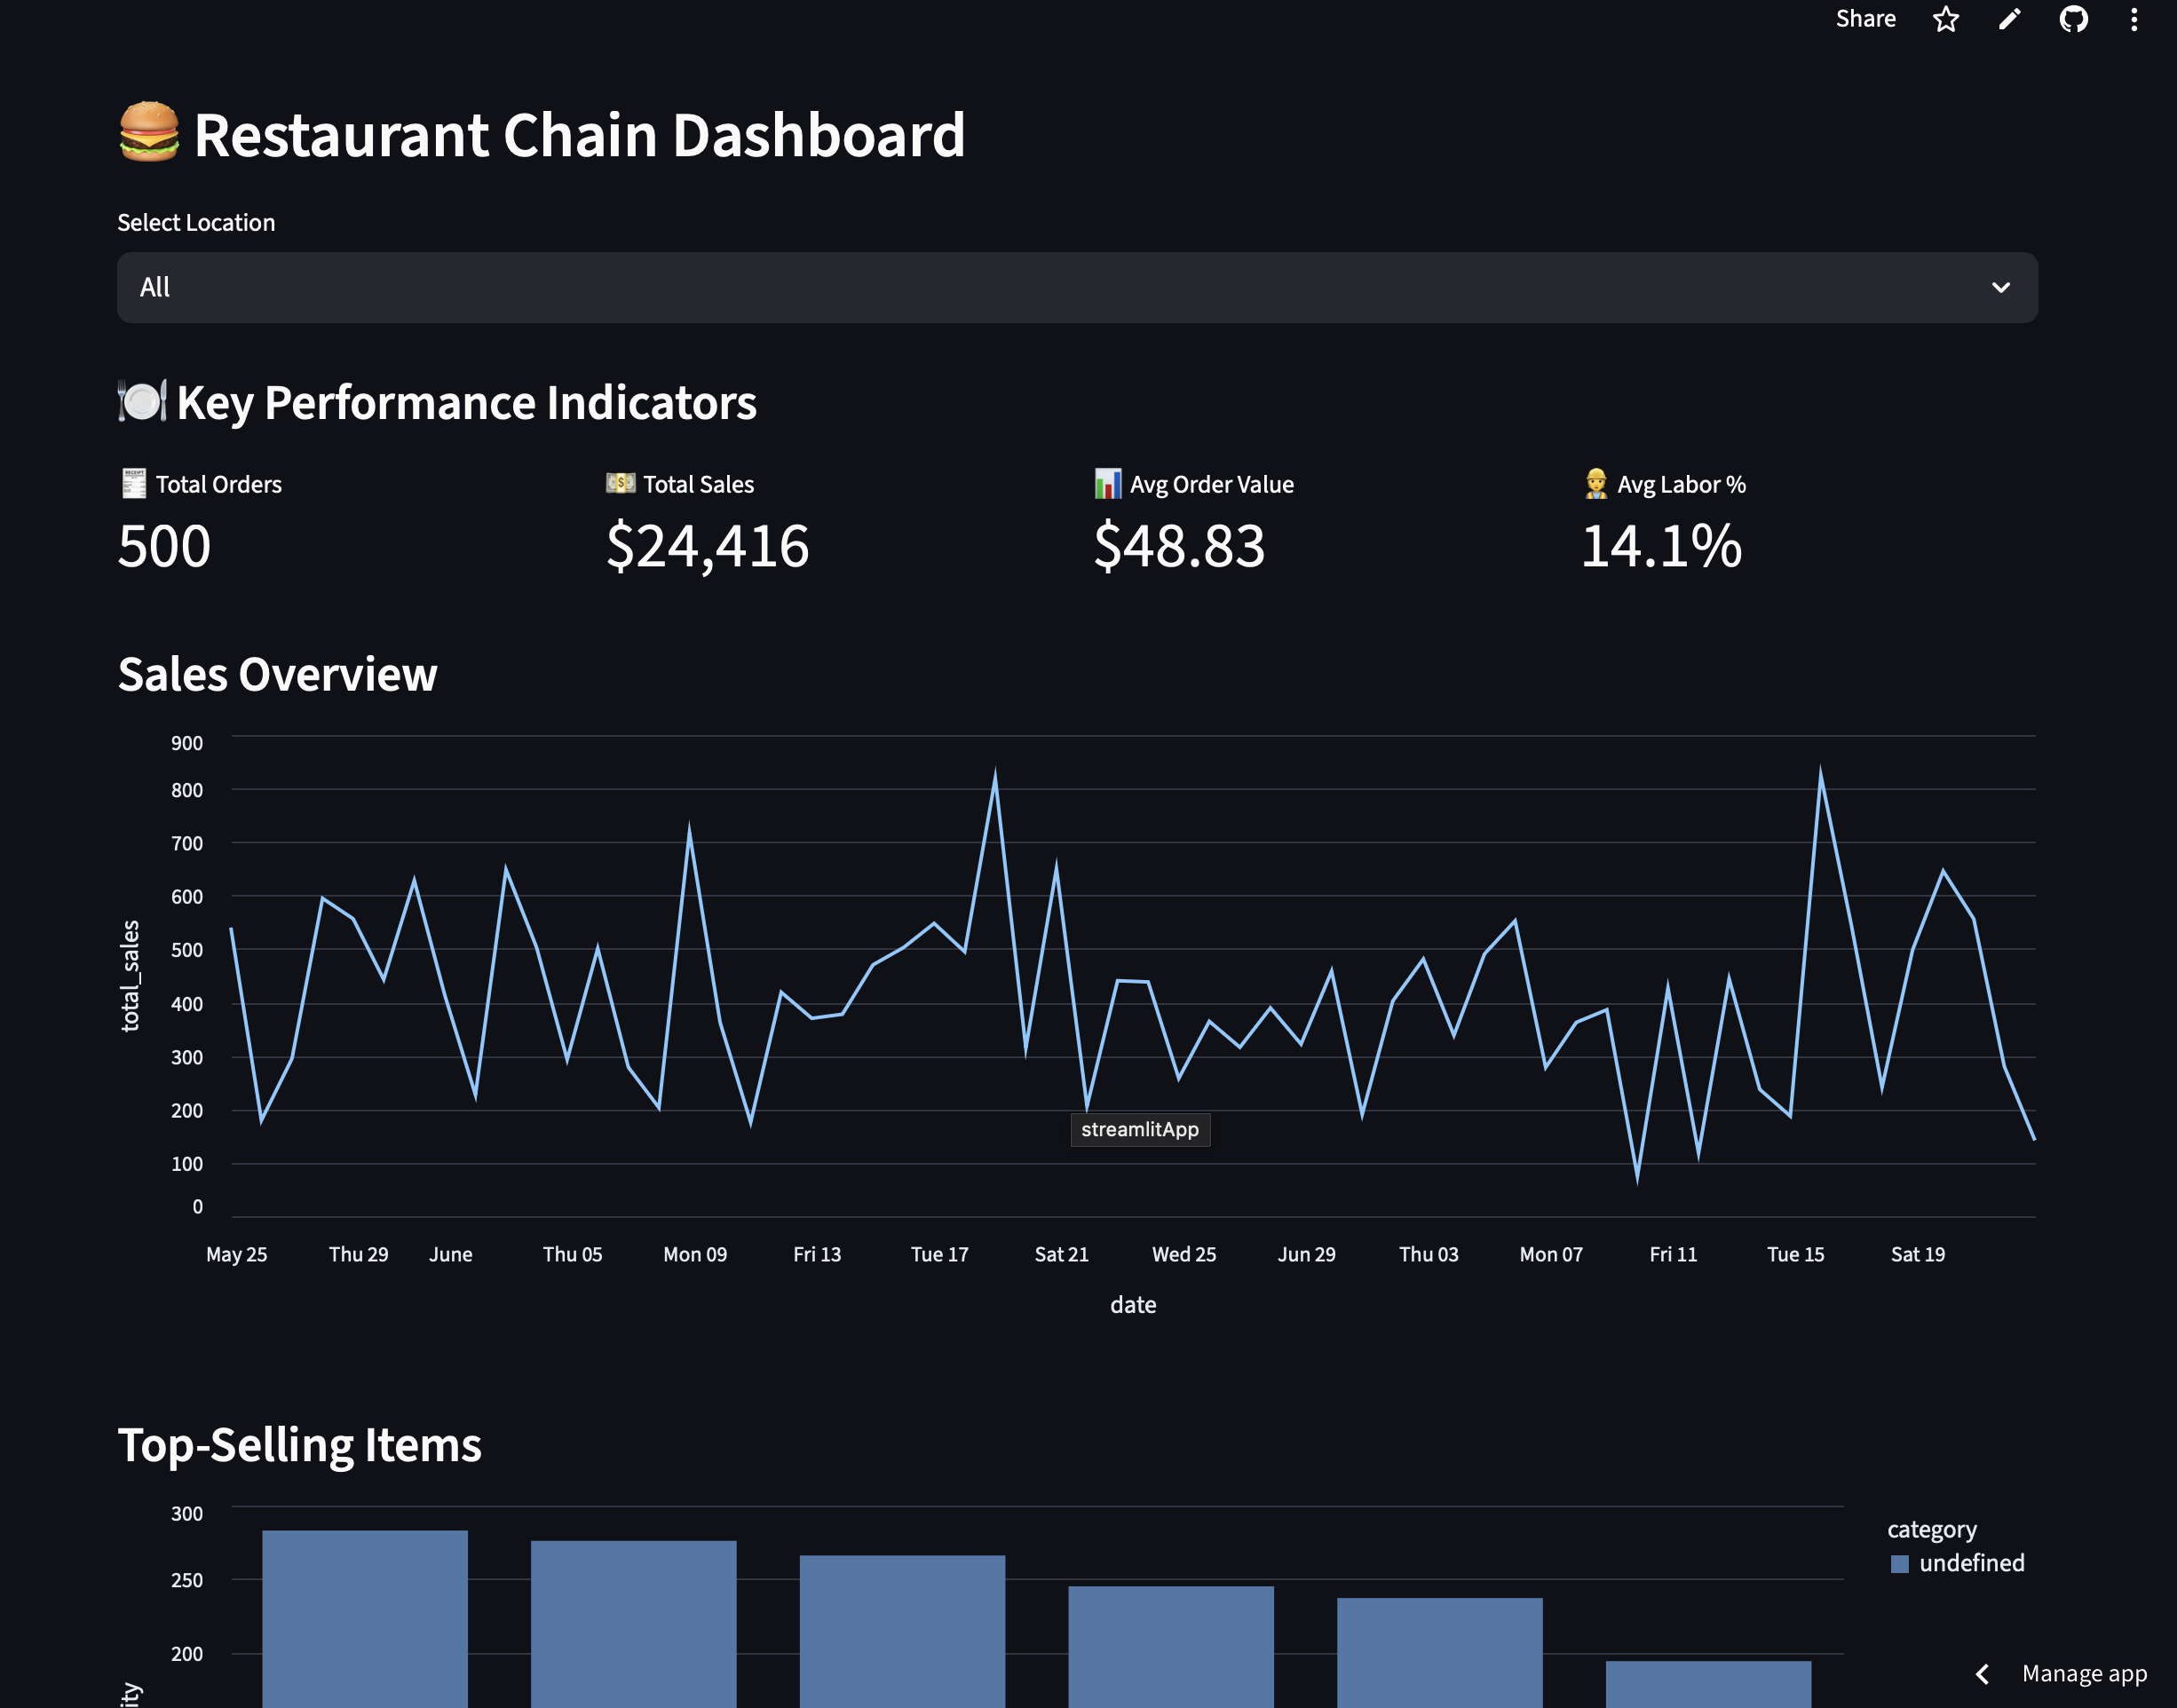
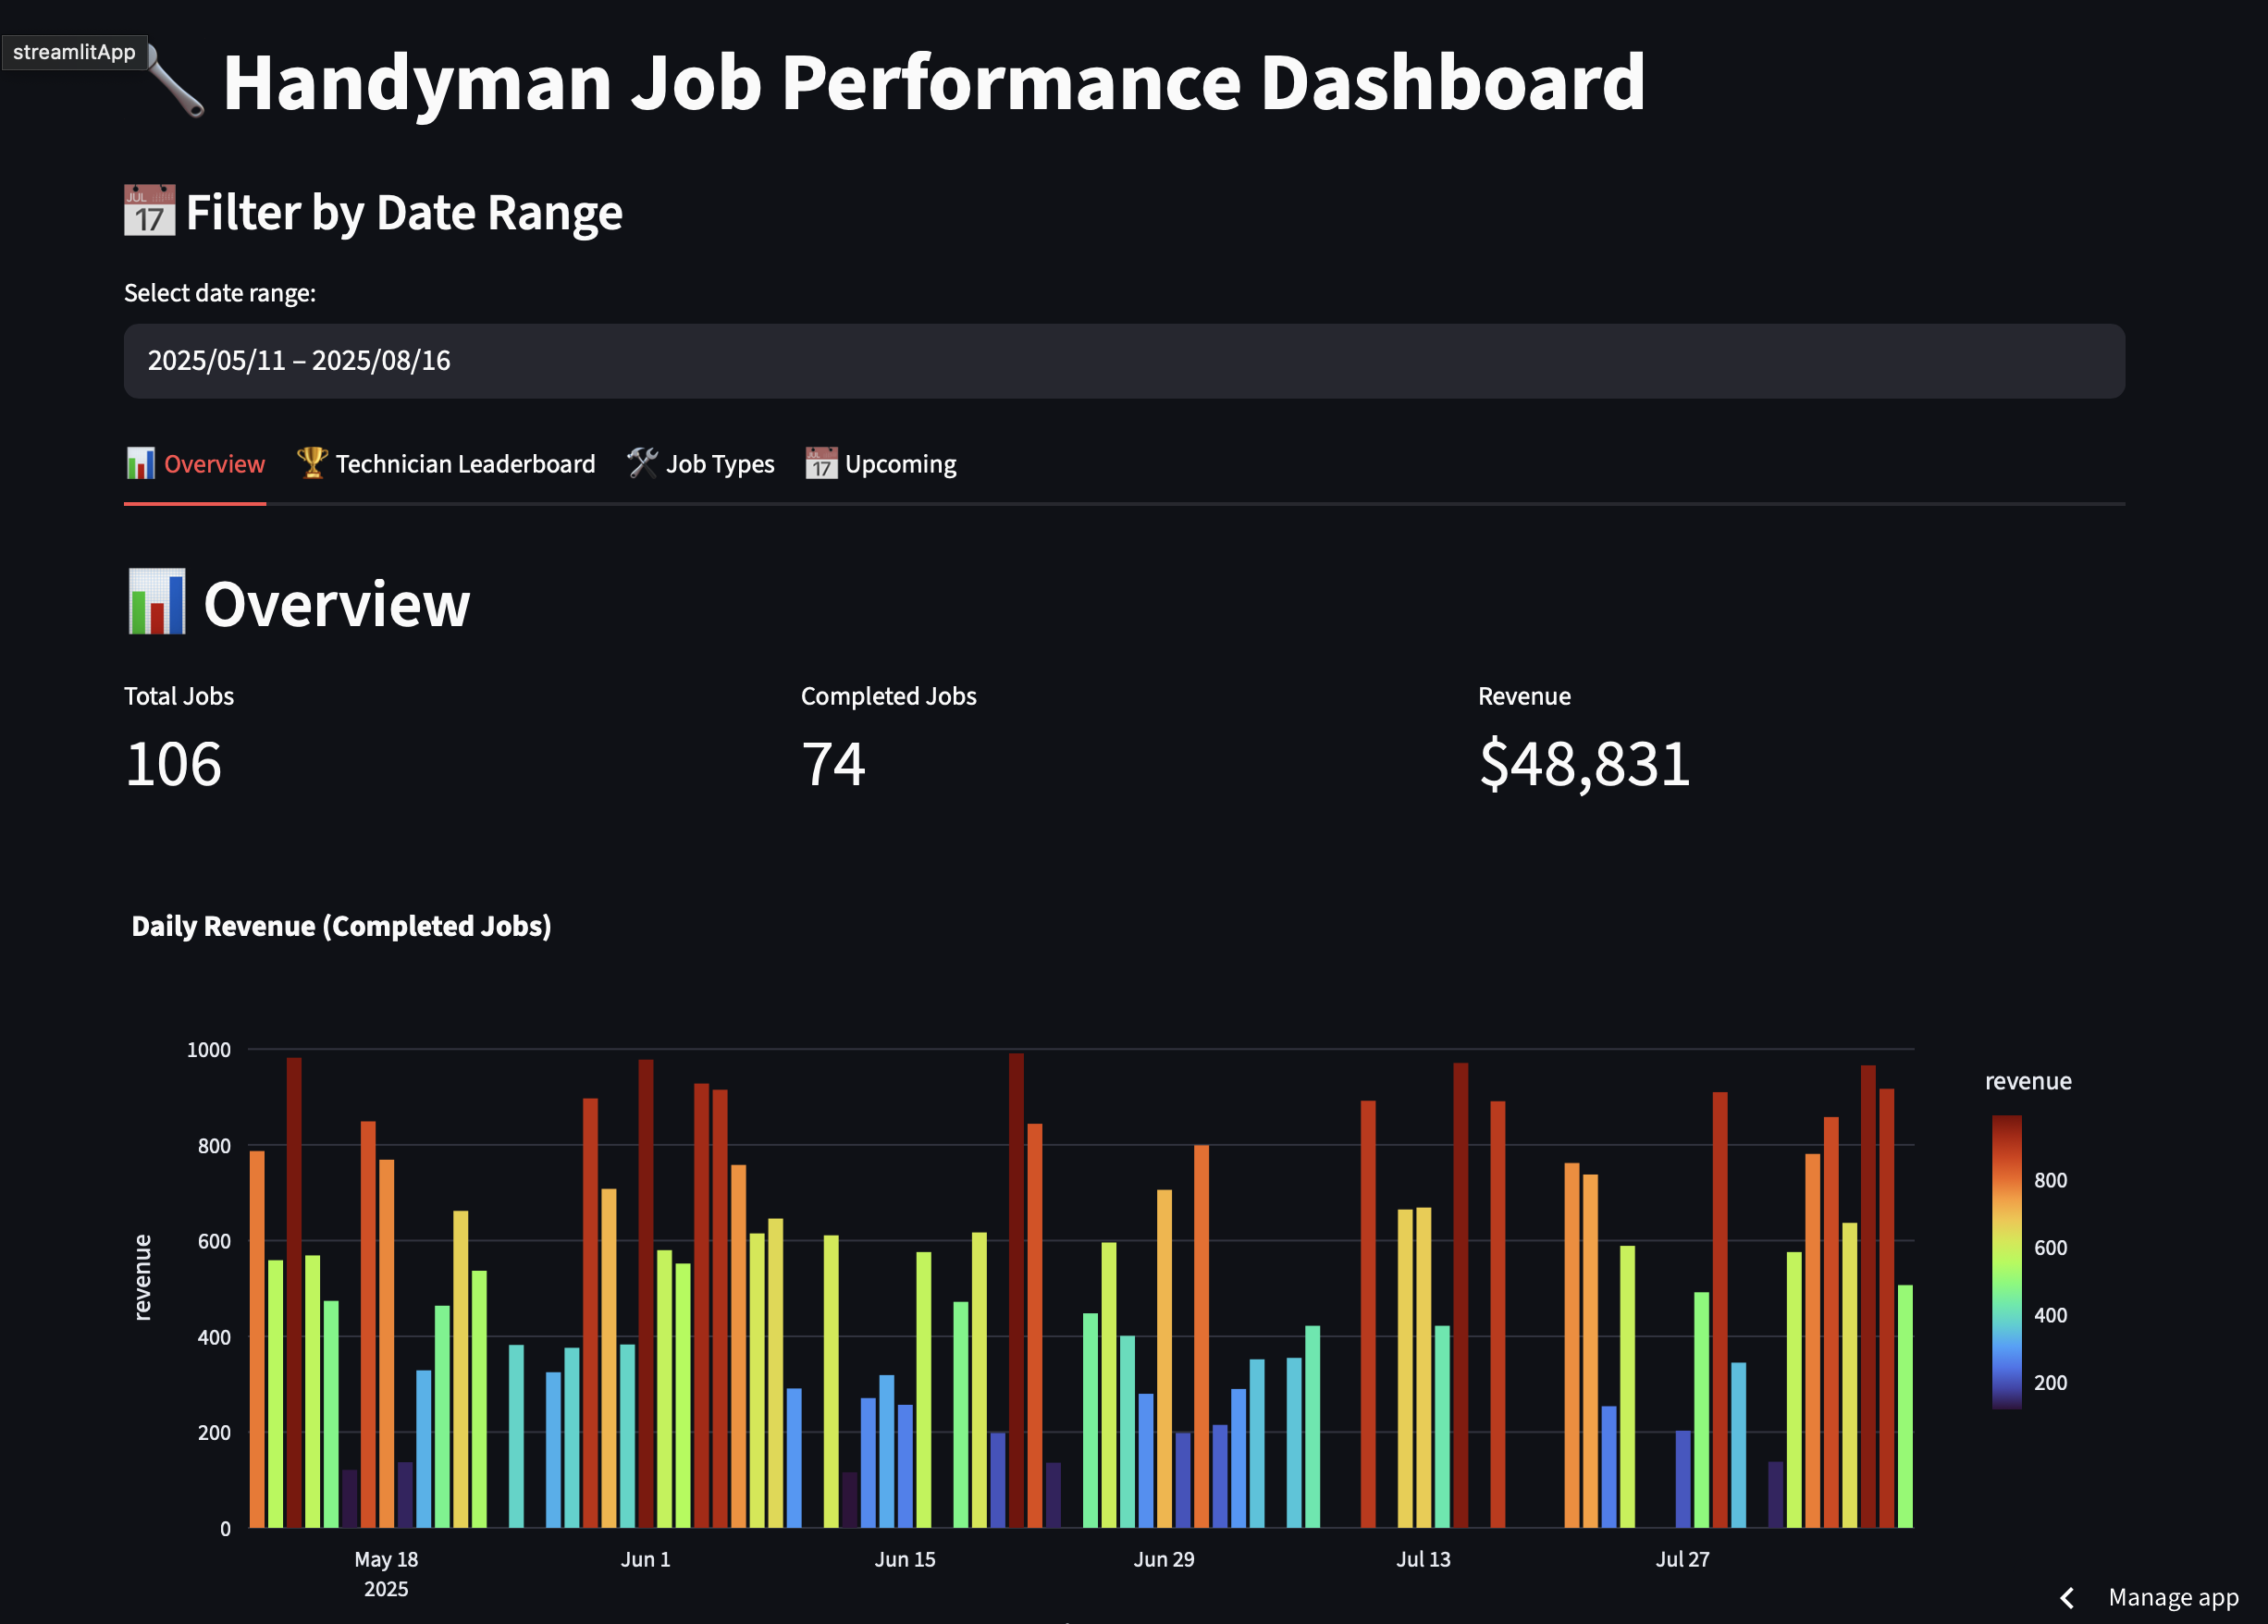
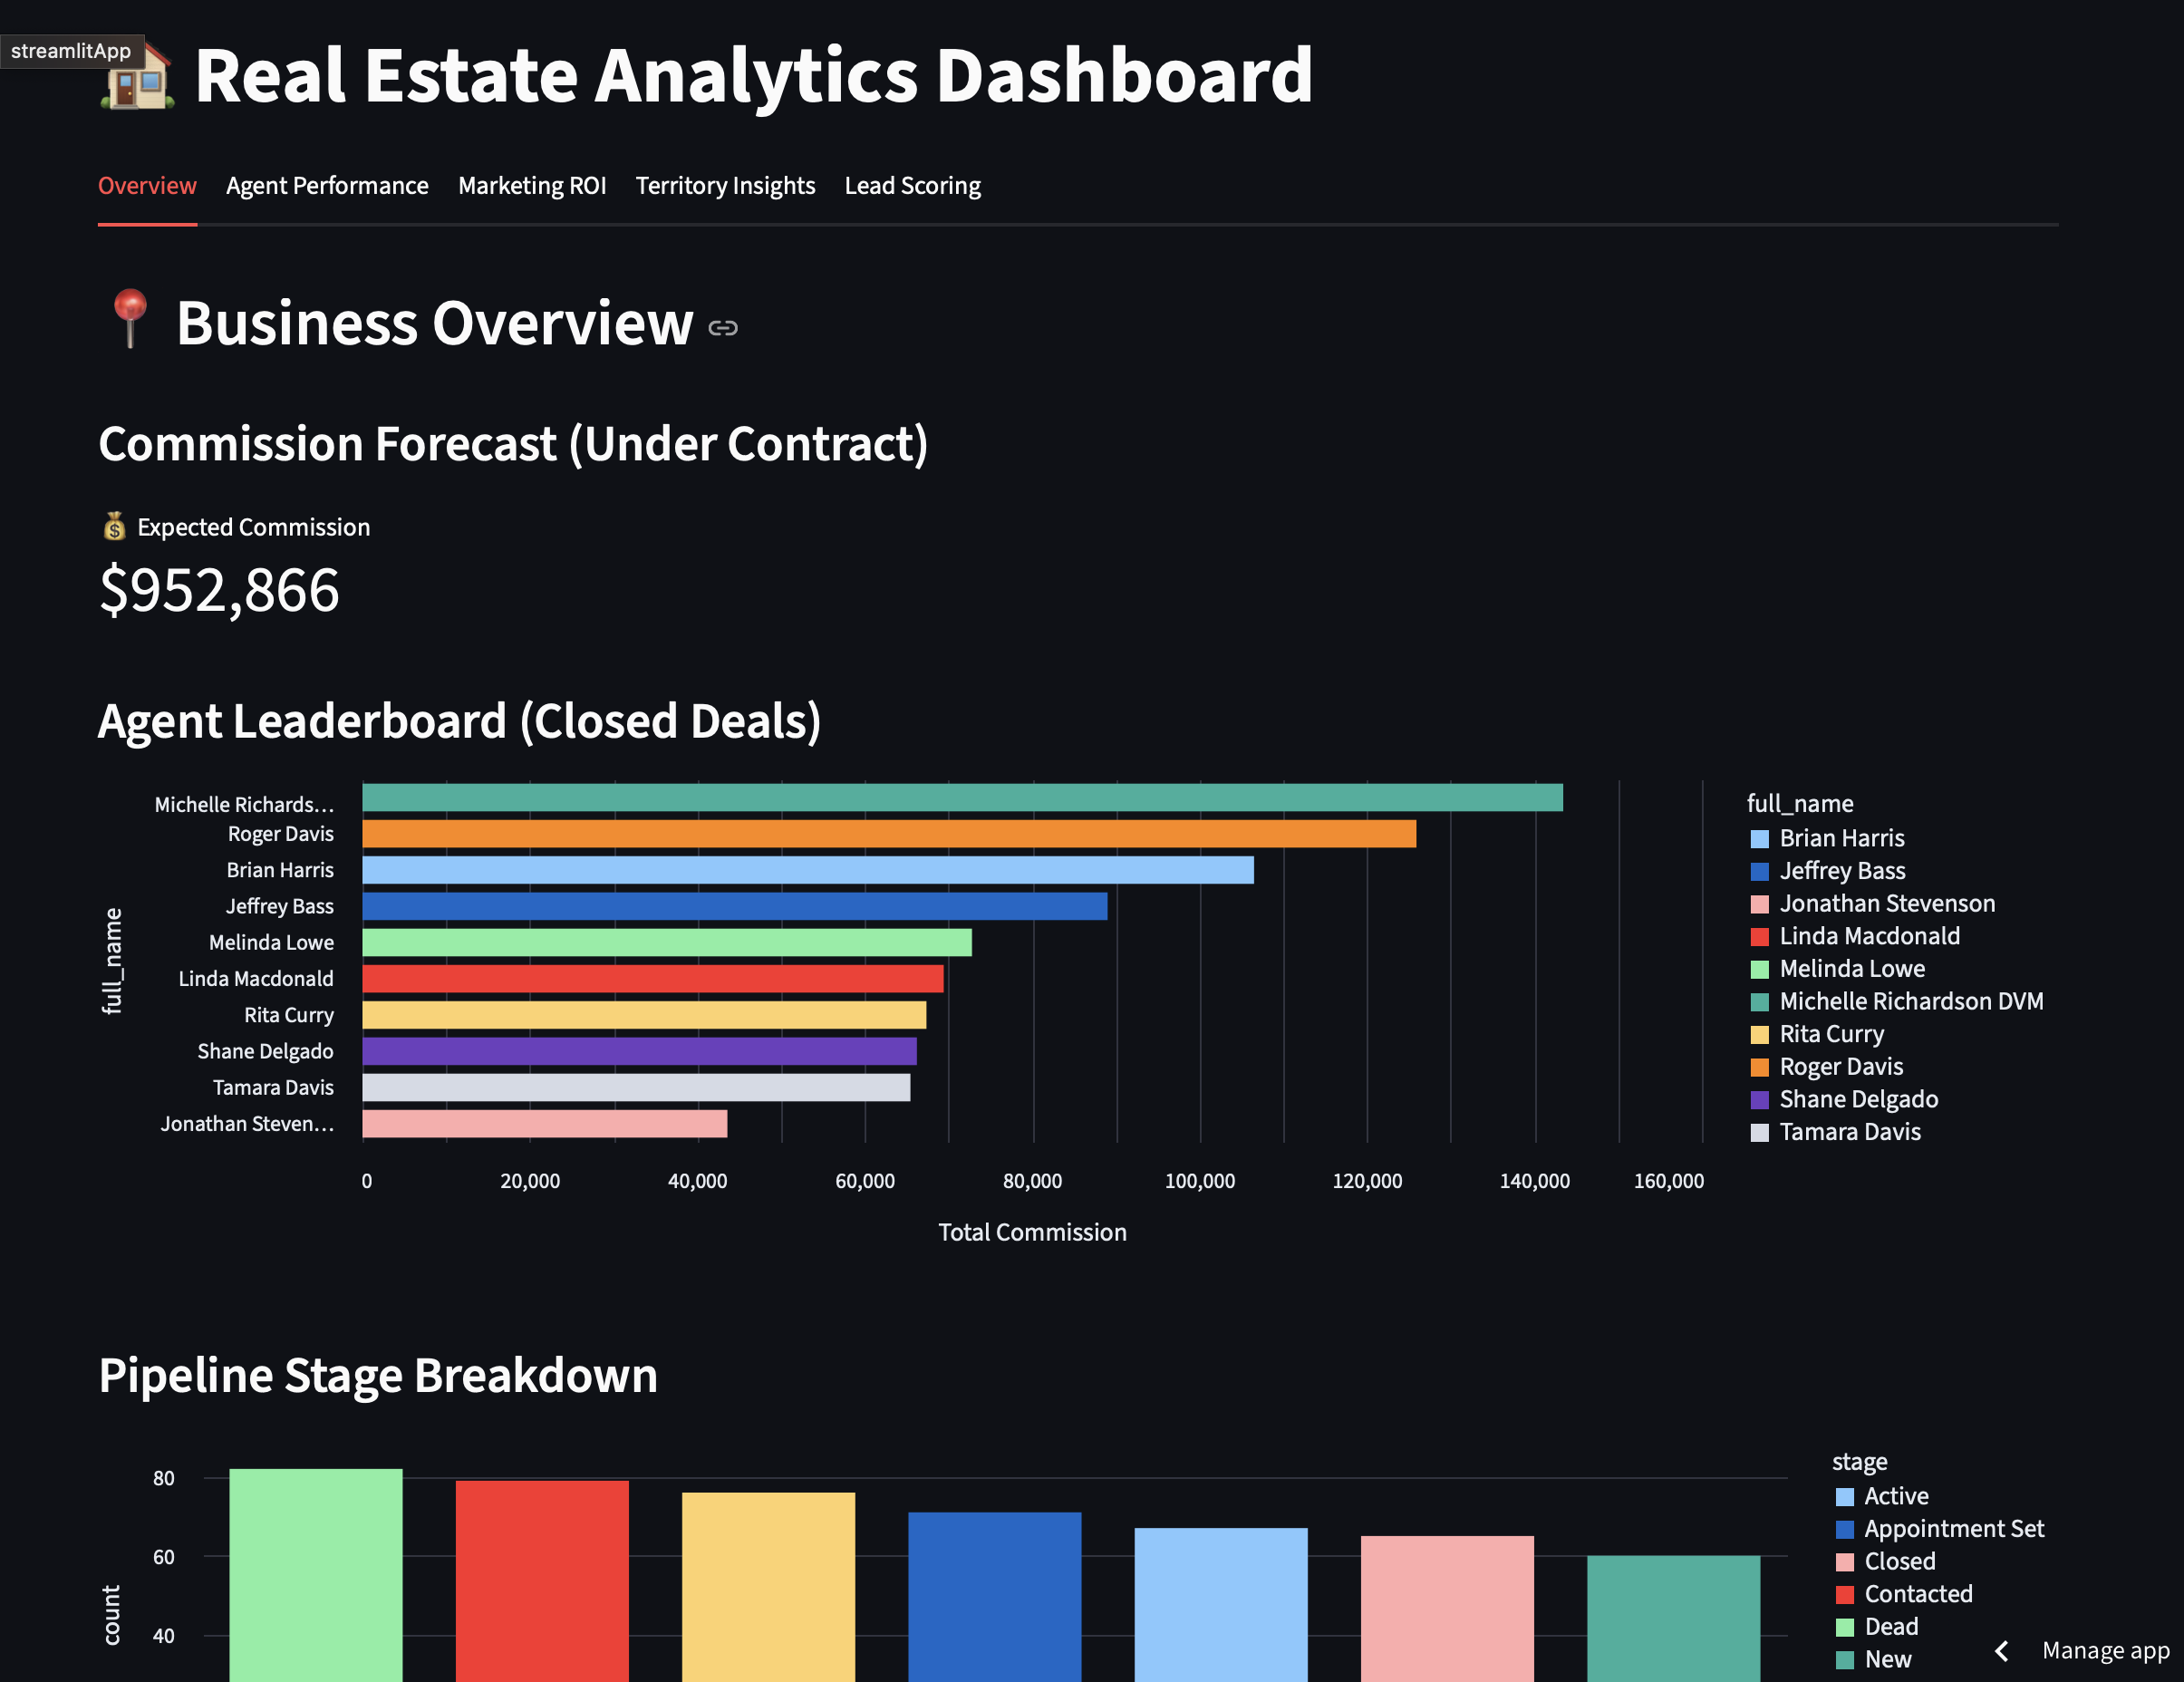
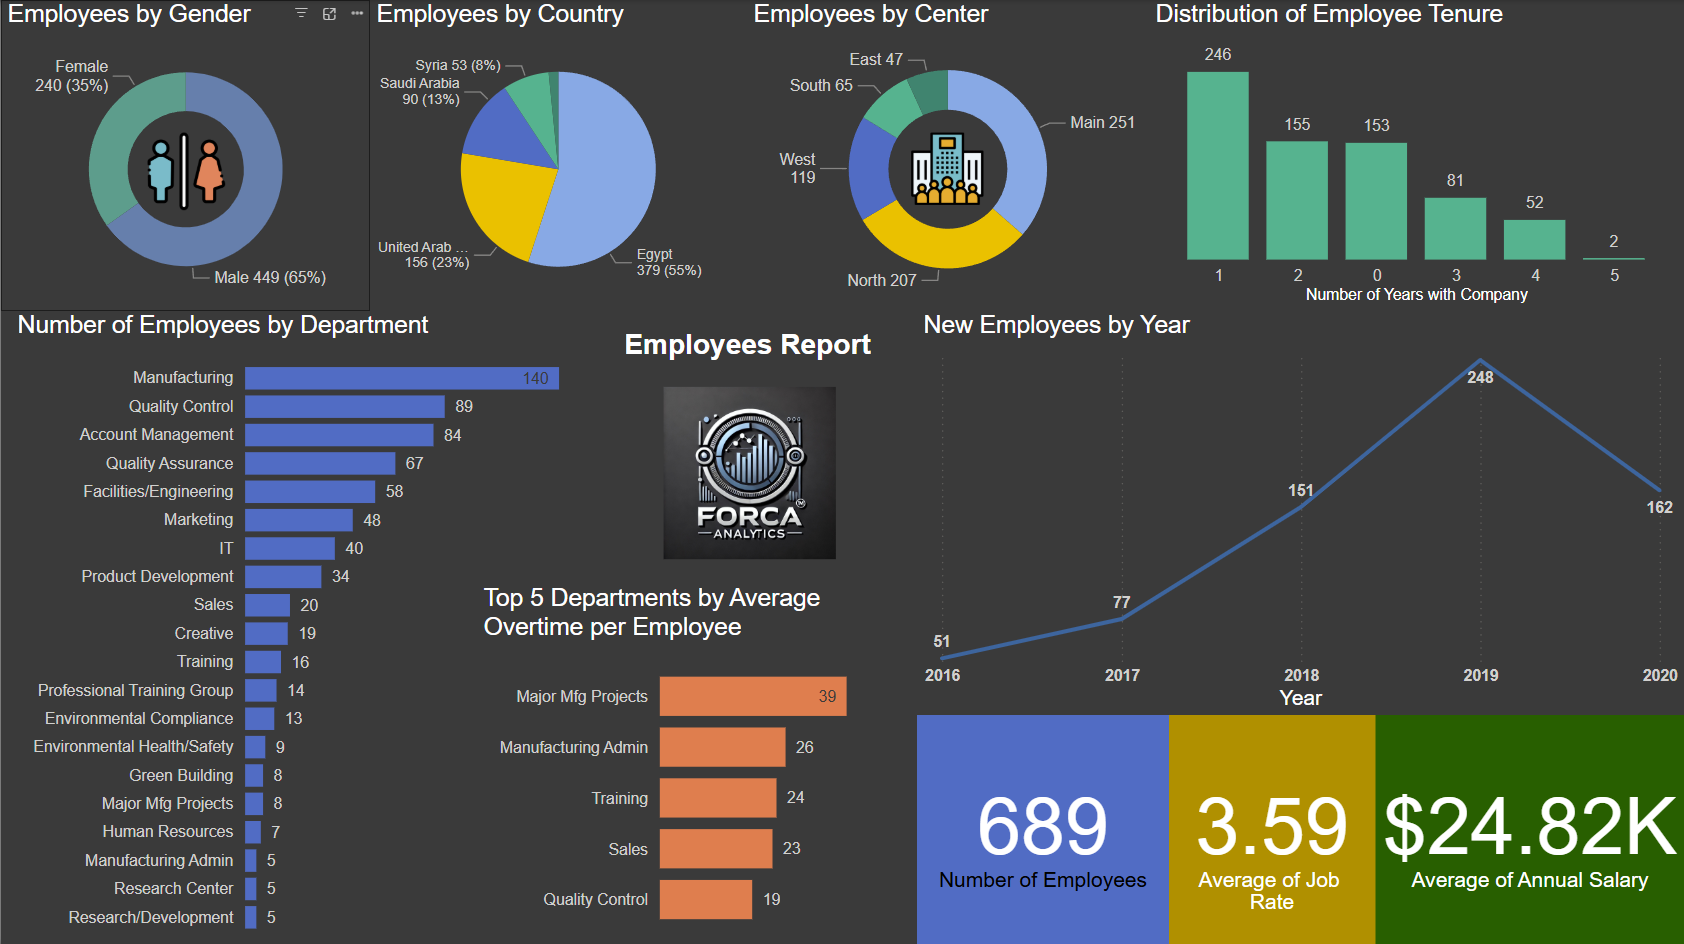
Sample dashboards you can click through — the kind of live, filterable analytics tools we build, adapted to your data and stack.
Real machine learning work — each one tied to a problem a business actually has.
Every project below started as a real question — who's about to cancel, what's the right price, what's hiding in the data. Each card explains the model in plain terms and how the same approach applies to a business like yours. Interactive demo dashboards are further down.
A model that scores each customer's risk of canceling — built from purchase history, support tickets, and order value. The same approach lets a business flag at-risk customers early and step in before they're gone.
Read the BreakdownAn analysis of how price changes moved sales across a product catalog, pinpointing the revenue-maximizing price for top products. The same work helps a business stop guessing on pricing — and stop leaving money on the table.
Read the BreakdownTopic modeling that reads thousands of product reviews and surfaces the themes — what people love, what they complain about. The same approach turns reviews, surveys, and support tickets into clear product and marketing direction.
Read the BreakdownA classifier that separates legitimate job listings from scams with 90% accuracy. The same approach can auto-screen applications, form submissions, or reviews — flagging the junk so your team only sees the real thing.
Read the BreakdownAnomaly detection that flags behavior breaking the normal pattern — odd logins, file access, USB events. The same method can watch a business for fraud, theft, or costly mistakes the moment they start.
Read the BreakdownSupervised learning over labeled network traffic to highlight command-and-control and beaconing patterns. The same detection approach gives a business early warning on threats hiding inside normal-looking activity.
Read the BreakdownSample dashboards you can click through — the kind of live, filterable analytics tools we build, adapted to your data and stack.
Yes. We build on what you already use (Toast, Jobber/ServiceTitan, Shopify, QuickBooks, Power BI, Sheets, custom CRMs, etc.) and centralize it into a clean model the AI and dashboards run on.
That's the point. The projects above were built on sample or public data — for a client build, we retrain the same approach on your data, integrate it into your workflow, and hand it off with documentation and ongoing support.
Want one of these adapted to your data? We'll scope it on a free call.
Schedule Your Free Consult